Man Utd top Premier League five-year net spend table after 2025 window
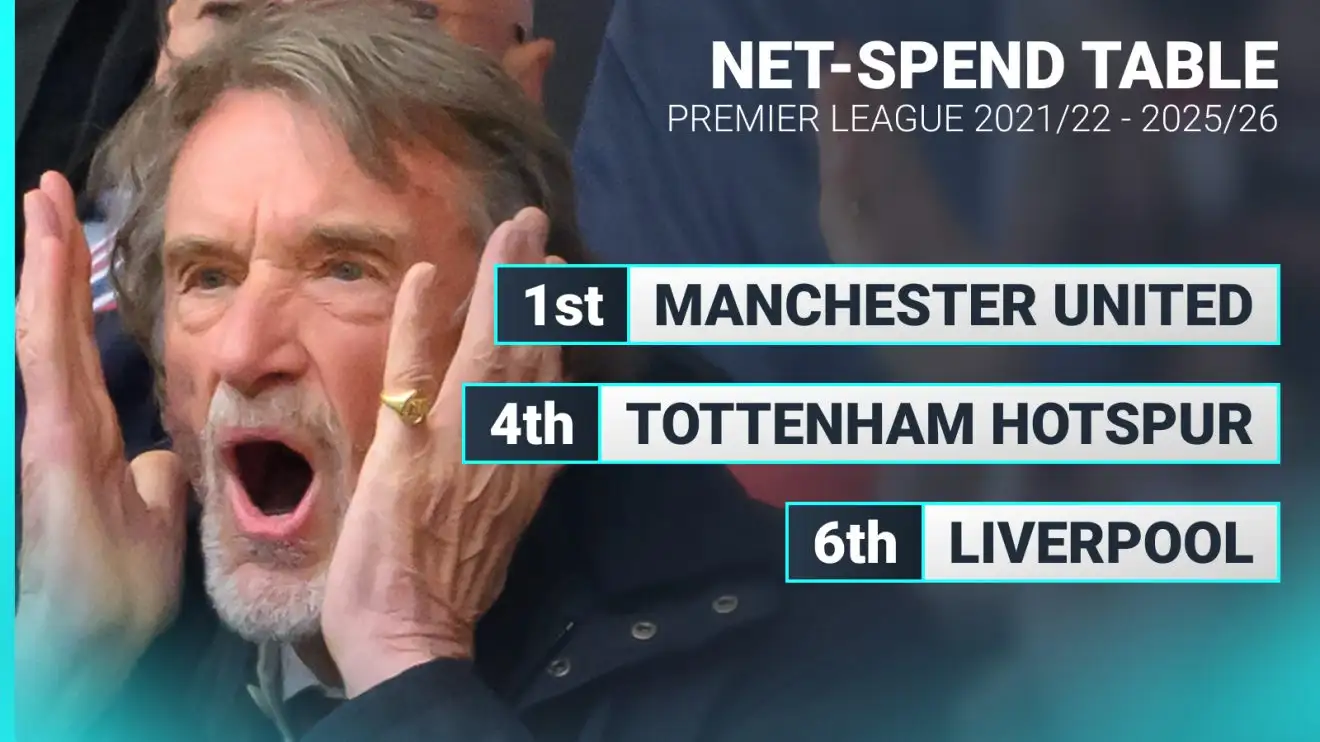
Forget the league table, we know it’s all about the Premier League net spend table! We take transfers from the summer of 2021 until the present day.
Bold denotes a profit; final league positions in brackets…
1) Manchester United five-year net spend: £-678.97m
25/26: £-153.48m
24/25: £-111.83m (15th)
23/24: £-127.27m (8th)
22/23: £-190.24m (3rd)
21/22: £-96.06m (6th)
2) Arsenal five-year net spend: £-672m
25/26: £-246.26m
24/25: £-20.81m (2nd)
23/24: £-144.26m (2nd)
22/23: £-141.39m (2nd)
21/22: £-118.26m (5th)
3) Chelsea five-year net spend: £-646.52m
25/26: £3.57m
24/25: £-33.76m (4th)
23/24: £-153.68m (6th)
22/23: £-473.95m (12th)
21/22: £31.16m (3rd)
4) Tottenham five-year net spend: £-564.66m
25/26: £-146.6m
24/25: £-91.42m (17th)
23/24: £-125.5m (5th)
22/23: £-117m (8th)
21/22: £-50.8m (4th)
5) Newcastle United five-year net spend: £-436.64m
25/26: £-98.45m
24/25: £-17.73m (5th)
23/24: £-85.79m (7th)
22/23: £-141.69m (4th)
21/22: £-108.17m (11th)
6) Liverpool five-year net spend: £-426.77m
25/26: £-228.6m
24/25: £29.14m (Champions)
23/24: £-92.26m (3rd)
22/23: £-53.96m (5th)
21/22: £-50.02m (2nd)
READ: Liverpool now top 10 biggest transfer window spends ever
7) Manchester City five-year net spend: £-344.72m
25/26: £-118.61m
24/25: £-87.75m (3rd)
23/24: £-104.64m (Champions)
22/23: £5.94m (Champions)
21/22: £-37.38m (Champions)
8) Nottingham Forest five-year net spend: £-329.1m
25/26: £-97.28m
24/25: £-15.58m (7th)
23/24: £-42.28m (17th)
22/23: £-167.48m (16th)
21/22: £-5.07m (4th in Championship)
9) West Ham United five-year net spend: £-321.35m
25/26: £-47.22m
24/25: £-82.6m (14th)
23/24: £21.47m (9th)
22/23: £-145.1m (14th)
21/22: £-58.25m (7th)
10) Bournemouth five-year net spend: £-153.09m
25/26: £85.72m
24/25: £-59.67m (9th)
23/24: £-111.27m (12th)
22/23: £-78.57m (15th)
21/22: £10.08m (2nd in Championship)
11) Crystal Palace five-year net spend: £-145.33m
25/26: £15.31m
24/25: £7.45m (12th)
23/24: £-56.2m (10th)
22/23: £-34.11m (11th)
21/22: £-70.97m (12th)
12) Sunderland five-year net spend: £-119.6m
25/26: £-136.5m
24/25: £5.41m (4th in Championship)
23/24: £-1.54m (16th in Championship)
22/23: £5.08m (6th in Championship)
21/22: £-0.2m (5th in League One)
13) Fulham five-year net spend: £-118.88m
25/26: £-24.32m
24/25: £-18.86m (11th)
23/24: £-16.55m (13th)
22/23: £-42.03m (10th)
21/22: £-13.1m (1st in Championship)
14) Burnley five-year net spend: £-107.43m
25/26: £-80.96m
24/25: £46.2m (2nd in Championship)
23/24: £-90m (19th)
22/23: £28.03m (1st in Championship)
21/22: £-7.47m (18th)
15) Brentford five-year net spend: £-97.07m
25/26: £49.95m
24/25: £-20.12m (10th)
23/24: £-52.3m (16th)
22/23: £-38.44m (9th)
21/22: £-31.33m (13th)
READ: The 20 biggest transfers in the world in the 2025 summer transfer window
16) Leeds United five-year net spend: £-74.65m
25/26: £-91.51m
24/25: £109.47m (1st in Championship)
23/24: £-1.95m (3rd in Championship)
22/23: £-41.44m (19th)
21/22: £-49.75m (17th)
17) Aston Villa five-year net spend: £-62.26m
25/26: £21.74m
24/25: £39.54m (6th)
23/24: £-65.44m (4th)
22/23: £-38.25m (7th)
21/22: £-2.32m (14th)
18) Wolves five-year net spend: £-35.37m
25/26: £11.5m
24/25: £-7.11m (16th)
23/24: £64.14m (14th)
22/23: £-97.64m (13th)
21/22: £-4.96m (10th)
19) Everton five-year net spend: £-12.06m
25/26: £-101.87m
24/25: £28.17m (13th)
23/24: £36.23m (15th)
22/23: £21.7m (17th)
21/22: £5.56m (16th)
20) Brighton five-year net spend: £10.1m
25/26: £65.2m
24/25: £-191.58m (8th)
23/24: £69.1m (11th)
22/23: £70.82m (6th)
21/22: £3.25m (9th)