Liverpool ‘should’ be in eighth as Premier League xPts table topped by shock team
Liverpool’s performances this season have only been good enough for eighth place in the Premier League, despite their actual position as leaders in the Premier League table.
The Reds have somehow won all their five Premier League games without ever playing particularly well, which should be pretty frightening to their supposed title rivals.
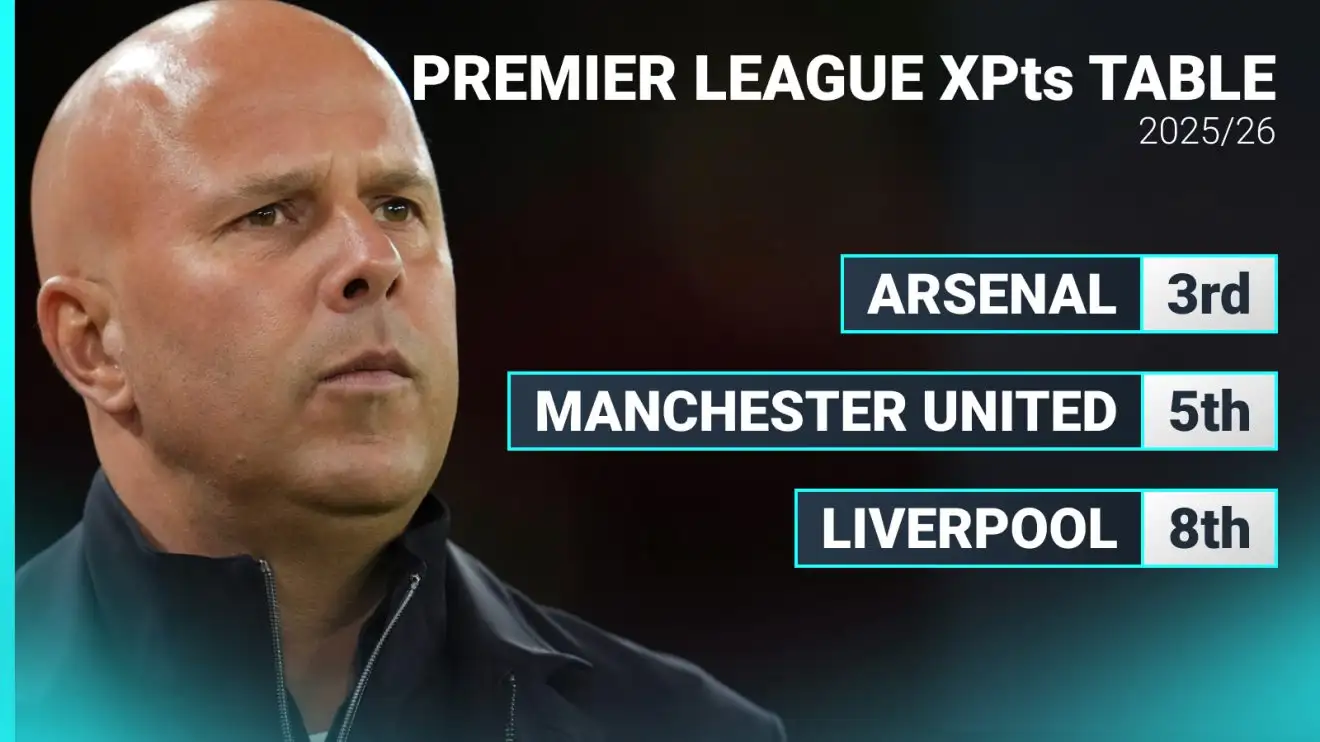
A table using XPts has Liverpool way down in eighth, three places below even Manchester United and five places below Arsenal, who have emerged from a difficult early fixture list in second place of the actual Premier League table.
Obviously, Liverpool have benefited from some excellent finishing; they have outscored their xG by almost four goals.
Now you might reasonably ask what XPts are.
What are XPts and how are they calculated?
According to football analytics expert McKay Johns:
In a basic approach, xPts is calculated by simulating each shot in a match.
For each shot, the model will generate a random number between 0 and 1. If the number is less than the value of the xG of that shot, it says it is a goal and adds to that game’s simulation tally, and at the end compares the actual goal tallies.
If a team wins that simulated match they get 3 points, draw they get 1 point, and a loss they get zero.
Running that same simulation over many iterations (say 1000) gives the output of how often a team would have won, drawn, or lost, and then we can take the average of all the points they have accumulated in the simulations to get their expected points which will fall between 0 and 3.
So basically, it’s running the game through algorithms and working out the average of how many points should have been garnered from each match according to the xG created and the xG conceded.
As Johns says: ‘The stat does well at giving us a decent idea of how many points a team should get on average, especially over a season.’
Over the first five Premier League games, there is a shock name at the top of the Premier League xPts table, as calculated by Understat.
Bournemouth have not created the highest xG this season (that is somehow Manchester United) nor conceded the least xG (that is the miserly Newcastle United) but their xPts across those five games have been calculated as 9.98. They are closely followed by the equally impressive Crystal Palace.
According to the same statistics, the worst three Premier League teams this season have been Wolves, Aston Villa and Burnley, so there is some small comfort for West Ham in those underlying stats.
The full Premier League xPts table:
1) Bournemouth
2) Crystal Palace
3) Arsenal
4) Manchester City
5) Manchester United
6) Newcastle United
7) Chelsea
8) Liverpool
9) Everton
10) Brighton
11) Tottenham
12) Brentford
13) Fulham
14) Sunderland
15) Leeds United
16) West Ham
17) Nottingham Forest
18) Wolves
19) Aston Villa
20) Burnley